


Grafana 这款软件的介绍
Grafana是⼀款近⼏年新兴的 开源数据绘图⼯具平台

Grafana 下载/安装/配置/运⾏
官⽅⽹站:
grafana.com
https://grafana.com/grafana/download
安装:https://grafana.com/grafana/download?pg=get&plcmt=selfmanaged-box1-cta1
二进制安装
wget https://dl.grafana.com/enterprise/release/grafana-enterprise-9.0.7.linux-amd64.tar.gz
tar -zxvf grafana-enterprise-9.0.7.linux-amd64.tar.gz
docker 安装:
docker run -d –name=grafana -p 3000:3000 grafana/grafana-enterprise
rpm安装
wget https://dl.grafana.com/enterprise/release/grafana-enterprise-9.0.7-1.x86_64.rpm
sudo yum install grafana-enterprise-9.0.7-1.x86_64.rpm
安装更简单了 直接 rpm就装完了
运⾏: 也更简单 更规范化 直接service就可以启动
service grafana-server start
默认运⾏在 3000端口
默认初始用户名和密码都是admin
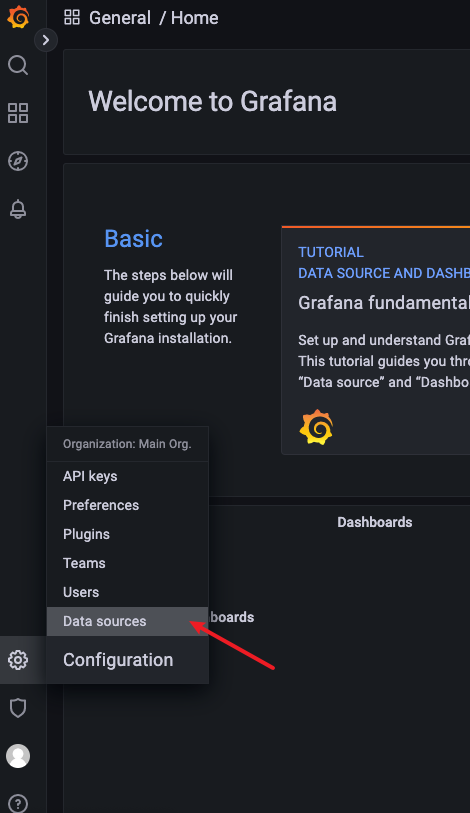
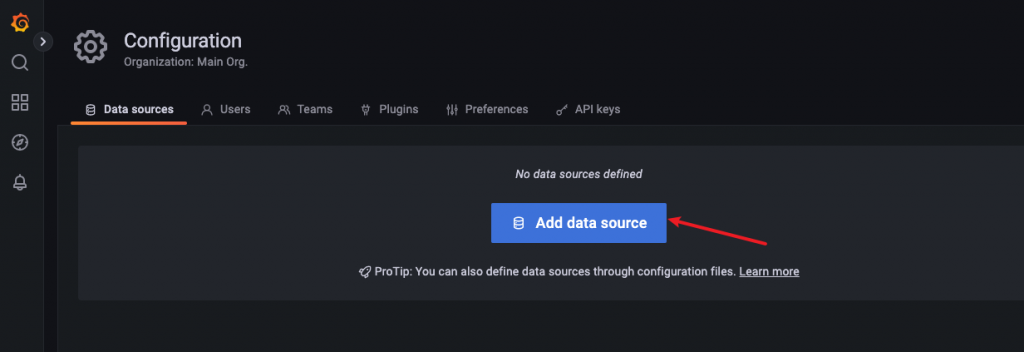
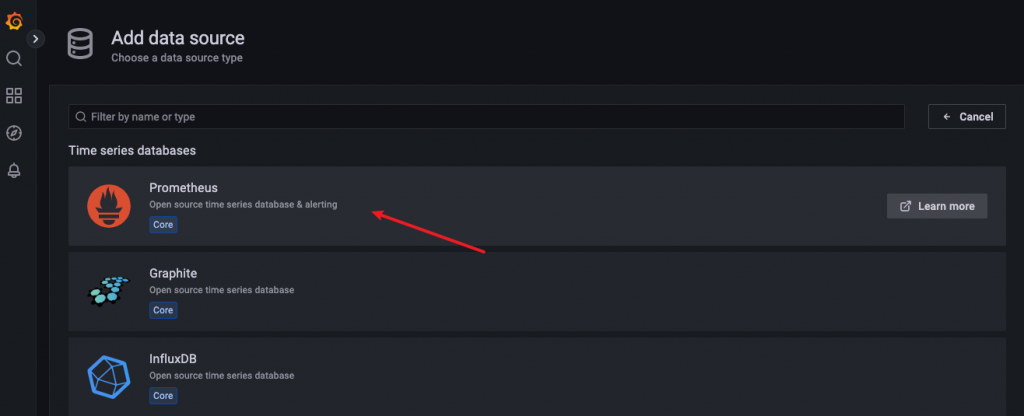
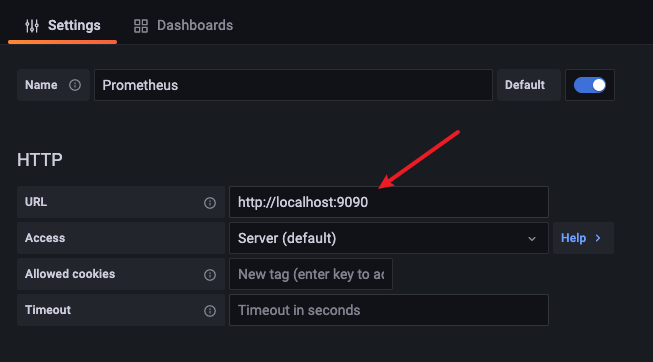
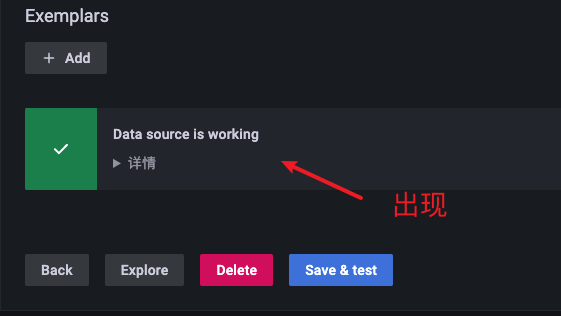
Grafana 设置数据源 连接prometheus_server
找到左上⾓的开始按钮 并选择 Data Sources

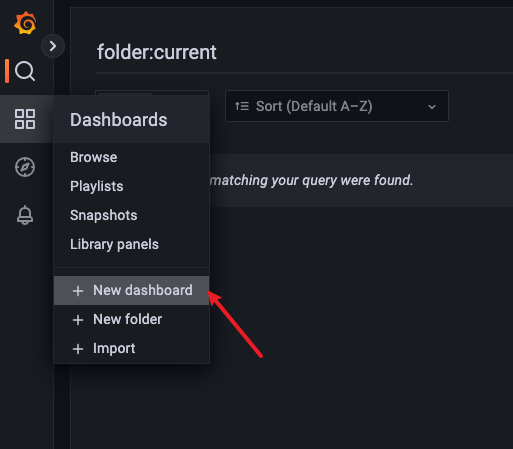
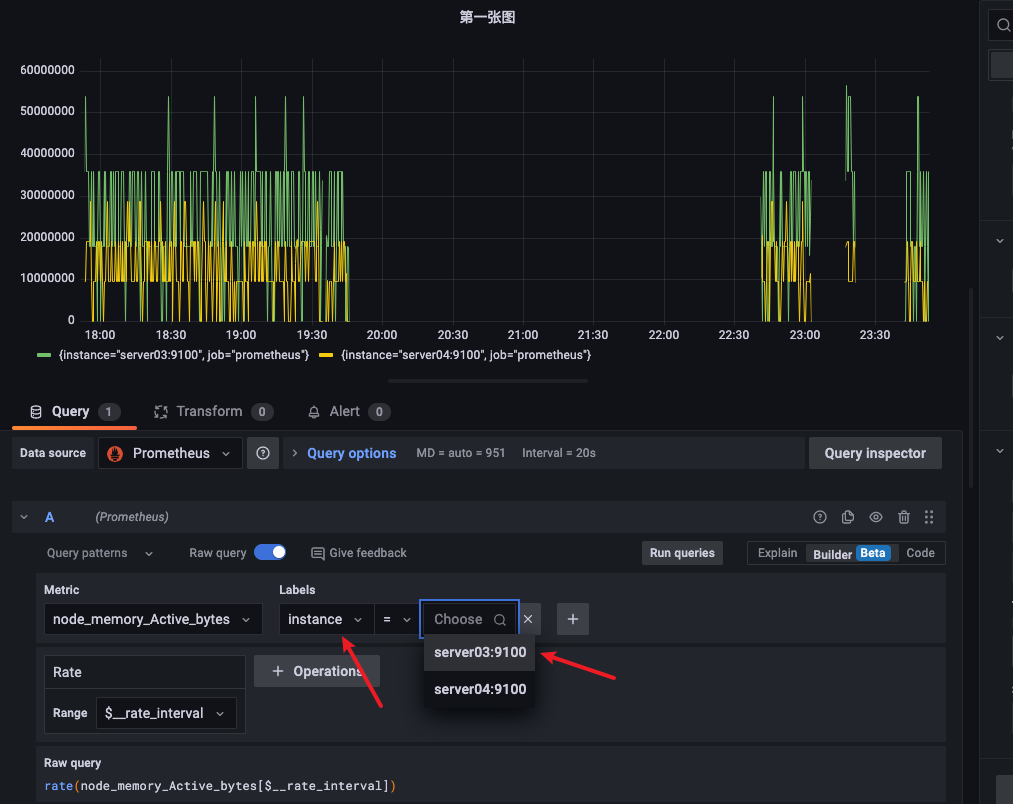
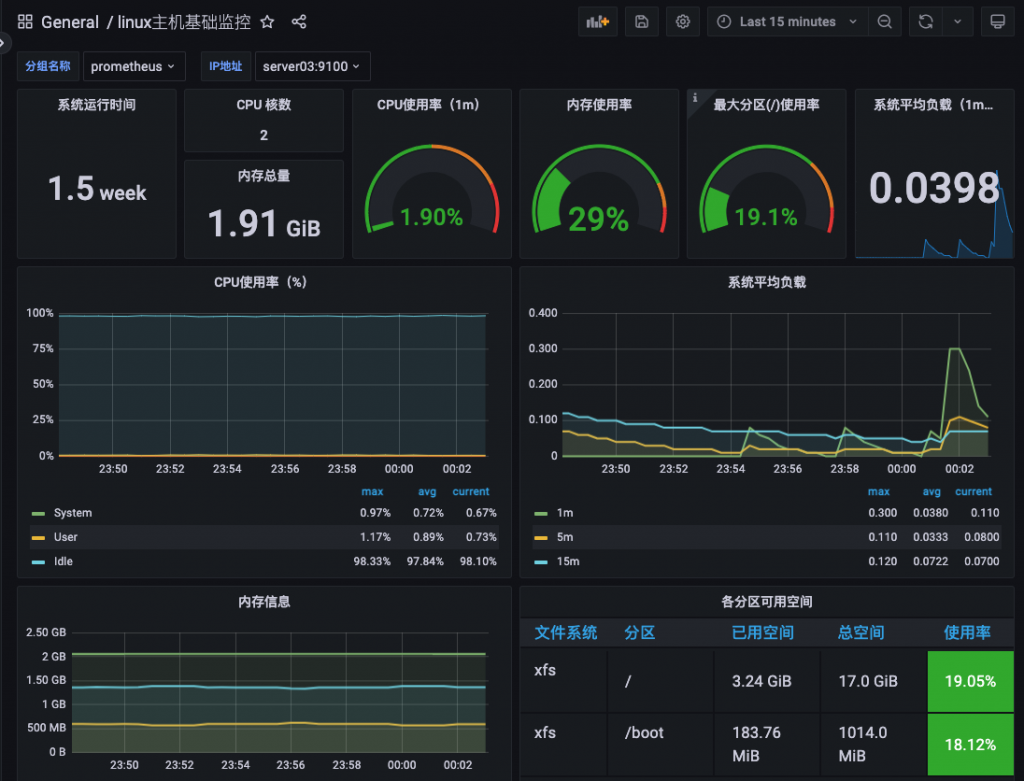
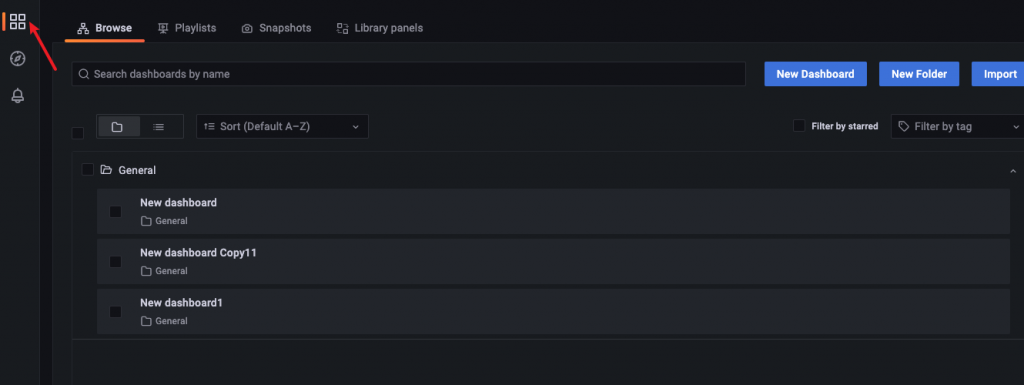
Grafana 建⽴ Dashboard

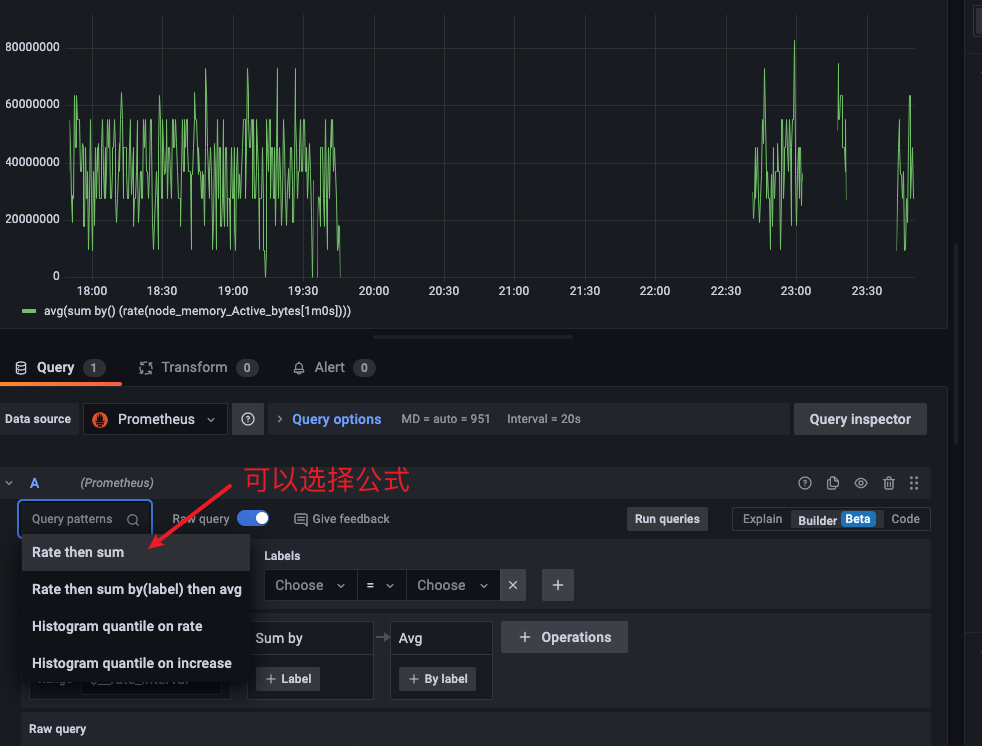
选择标签
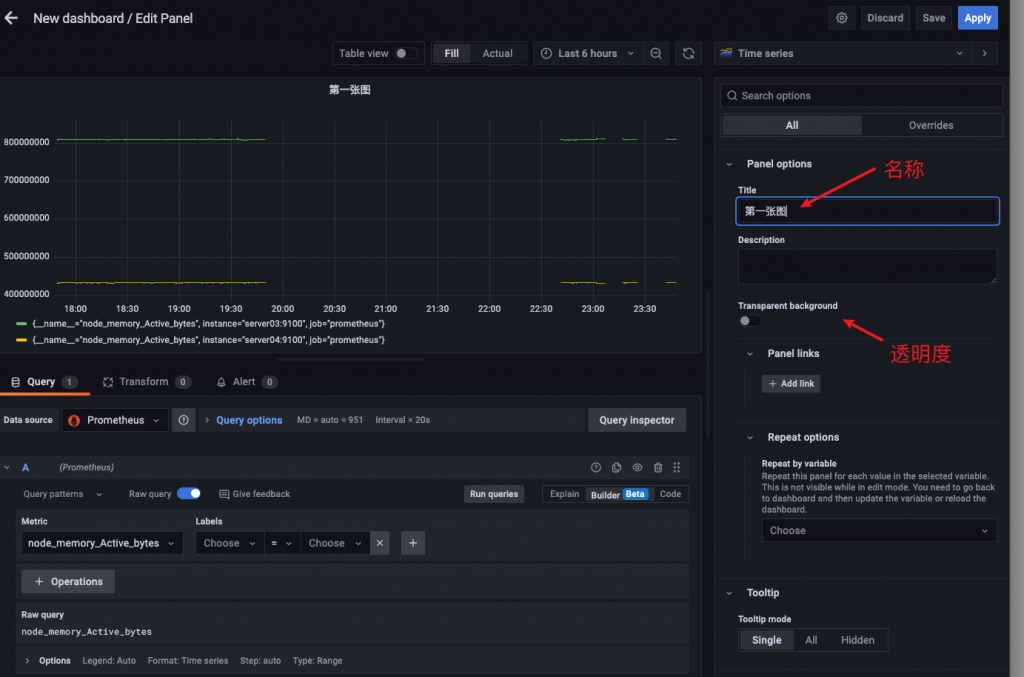
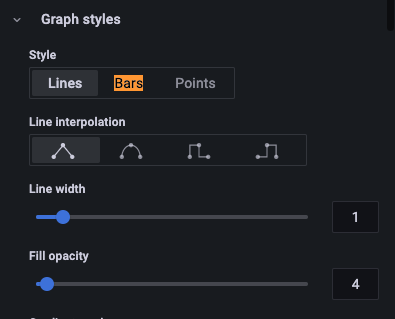
折线图美化
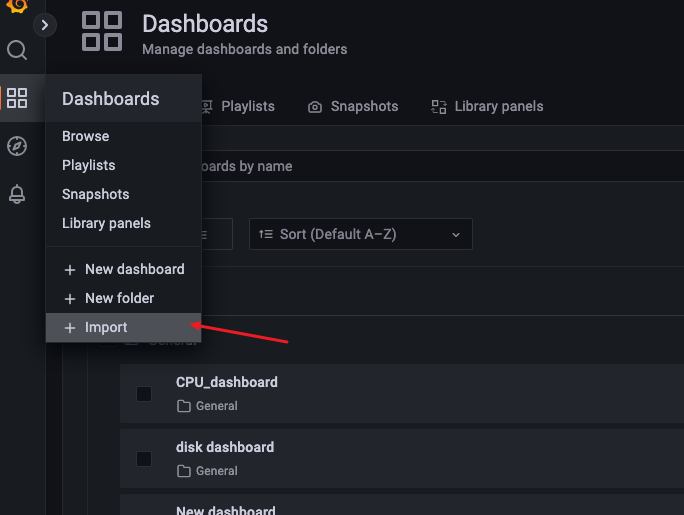
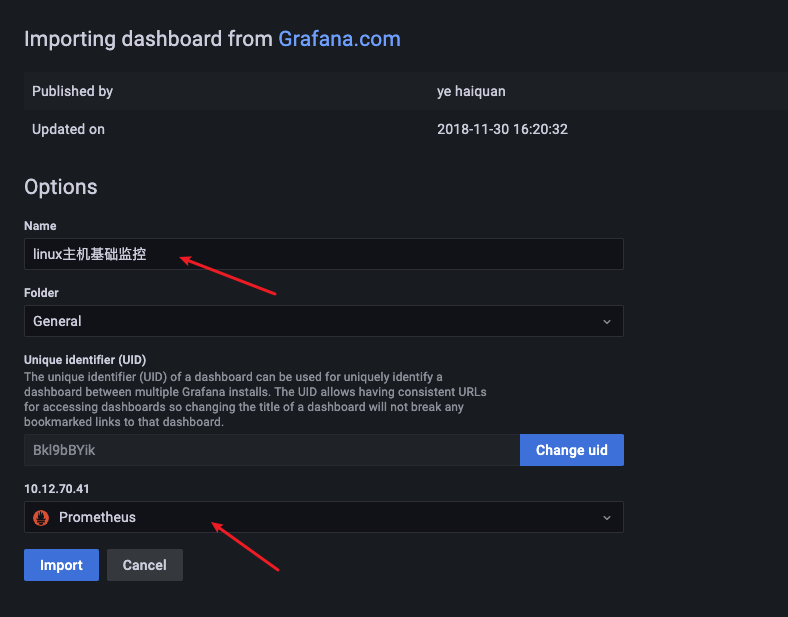
直接使用模版导入dashboard
https://grafana.com/grafana/dashboards/?search=prometheus
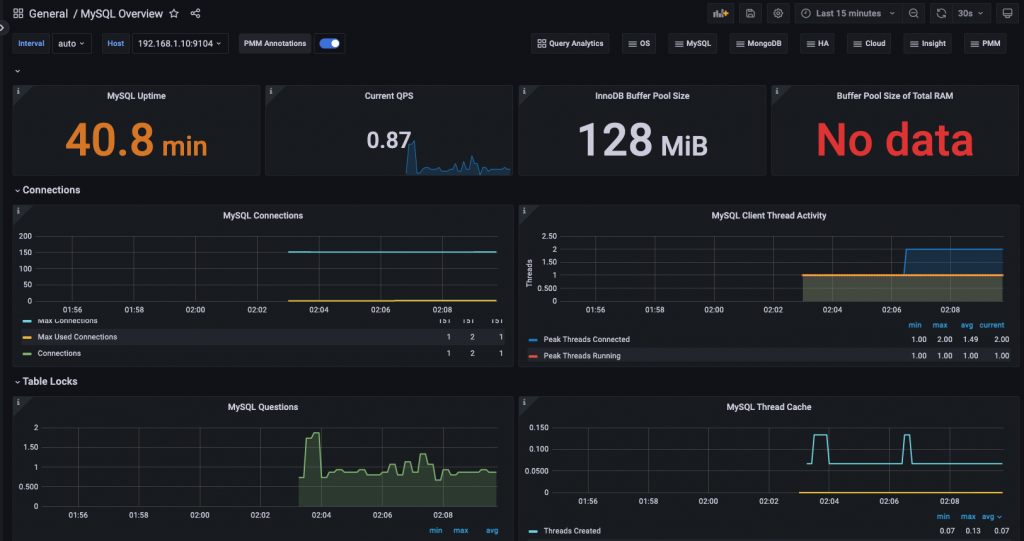
推荐使用一个基础监控模版连接:
https://grafana.com/grafana/dashboards/9276-1-cpu/
填写名字选择prometheus,点击import
grafana监控docker服务器:
cAdvisor(Container Advisor)用于收集正在运行的容器资源使用和性能信息
官方地址:
https://github.com/google/cadvisor
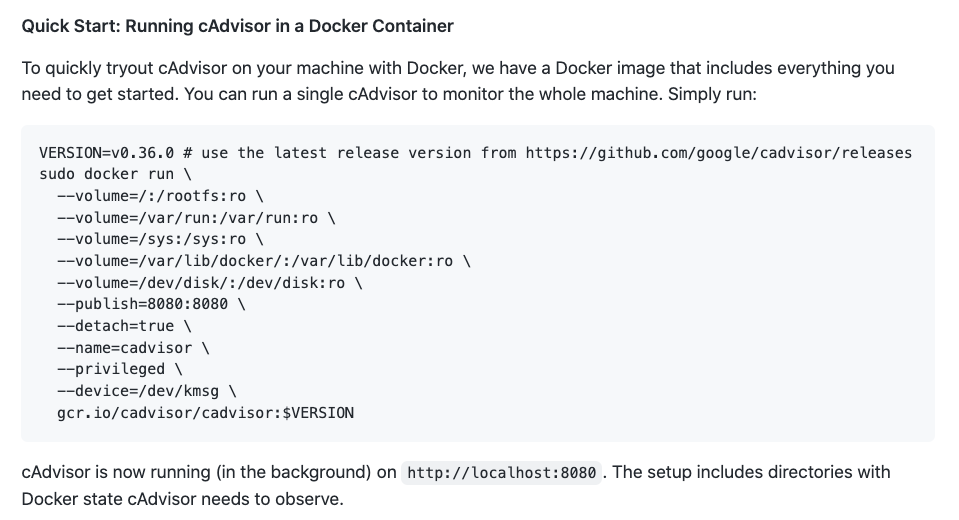
sudo docker run \
--volume=/:/rootfs:ro \
--volume=/var/run:/var/run:ro \
--volume=/sys:/sys:ro \
--volume=/var/lib/docker/:/var/lib/docker:ro \
--volume=/dev/disk/:/dev/disk:ro \
--publish=8080:8080 \
--detach=true \
--name=cadvisor \
--privileged \
--device=/dev/kmsg \
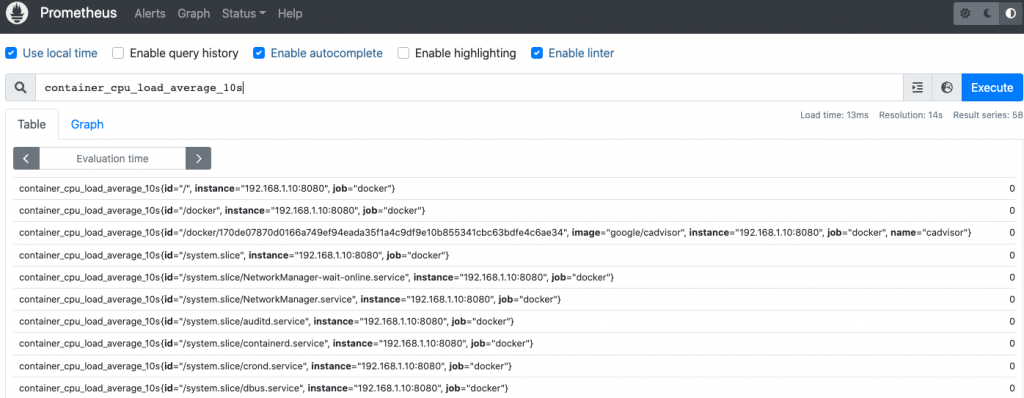
google/cadvisorcadvisor收集的性能指标
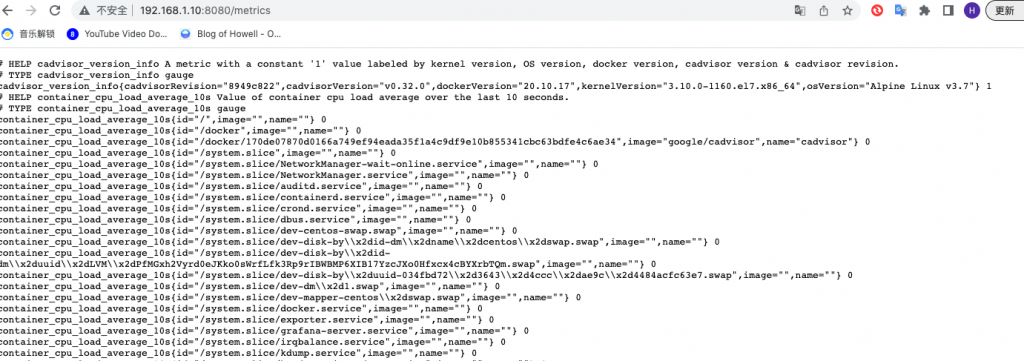
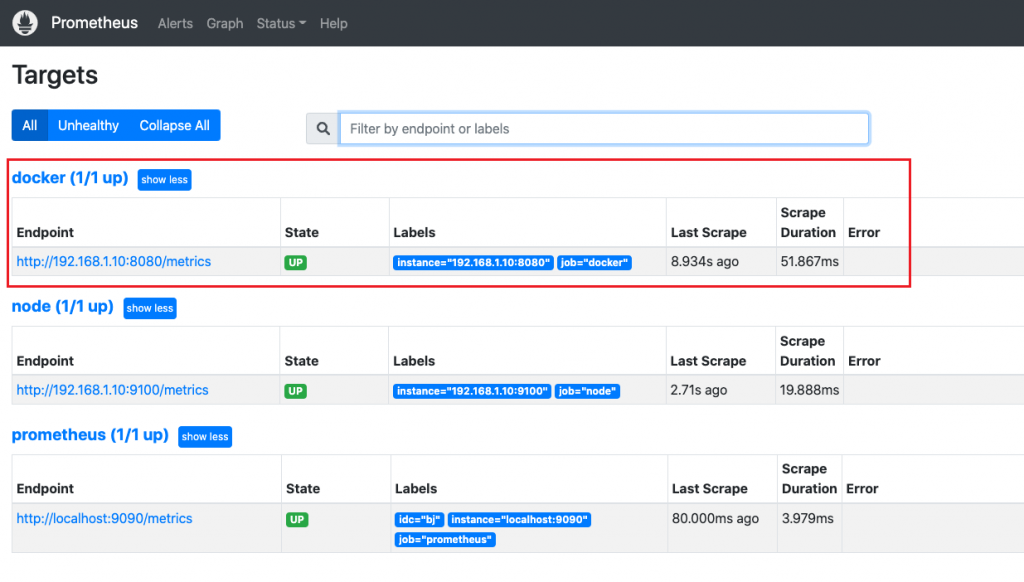
加入到prometheus中
vi /usr/local/prometheus/prometheus.yml
  - job_name: "docker"
    static_configs:
    - targets: ['192.168.1.10:8080']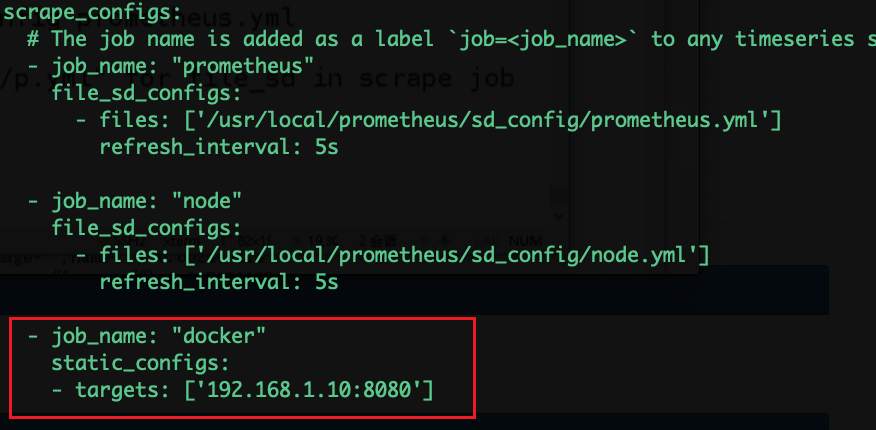
导入图表:
https://grafana.com/dashboards/193
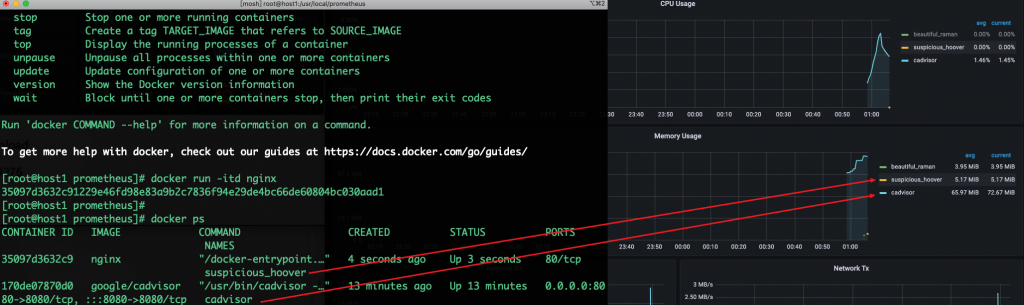
测试:
docker run nginx
mysql_exporter:用于收集MySQL性能信息
采集器官方地址:
https://github.com/prometheus/mysqld_exporter
安装mariadb测试
yum -y install mariadb-server
systemctl start mariadb
mysql
授权:
CREATE USER 'exporter'@'localhost' IDENTIFIED BY '123456';
GRANT PROCESS, REPLICATION CLIENT, SELECT ON *.* TO 'exporter'@'localhost';
select host,user from mysql.user;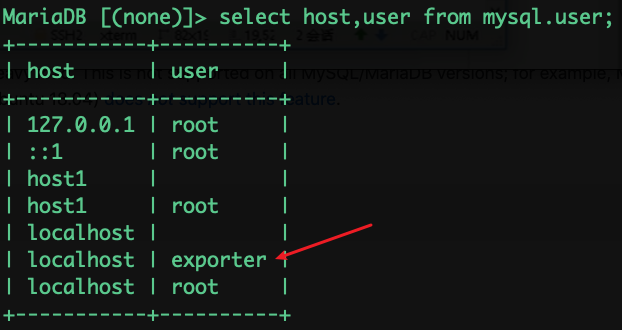
加目录面密码配置文件添加
vi .my.cnf
[client]
user=exporter
password=123456
mysql_exporter
安装:https://prometheus.io/download/
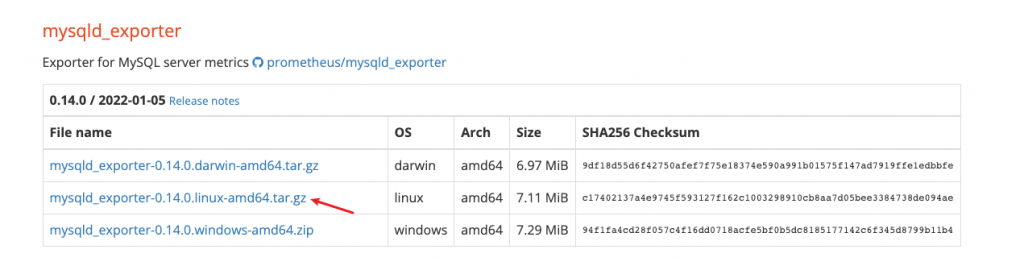
tar -xvf mysqld_exporter-0.14.0.linux-amd64.tar.gz
ln -s mysqld_exporter-0.14.0.linux-amd64 mysqld_exporter
cd mysqld_exporter
./mysqld_exporter –config.my-cnf .my.cnf
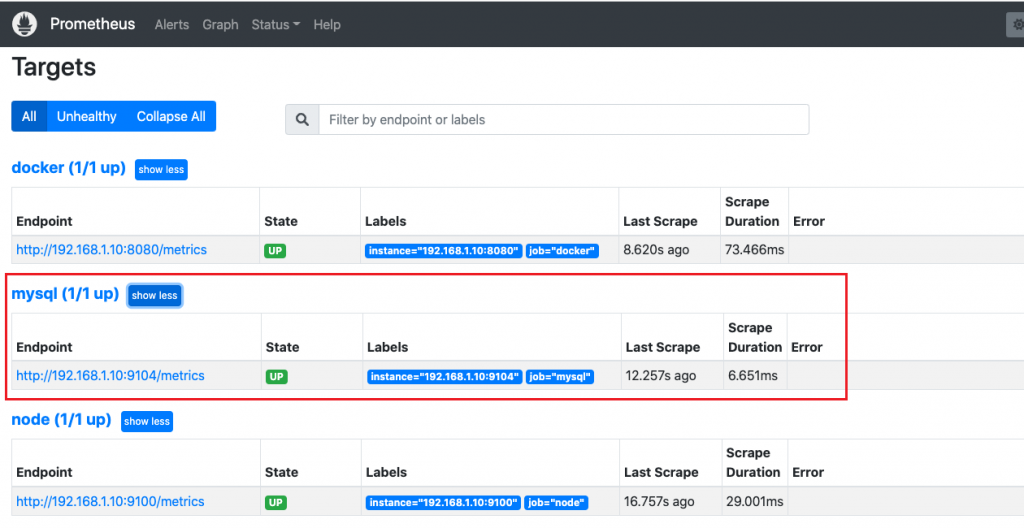
客户端9104暴露信息:
vi /usr/local/prometheus/prometheus.yml
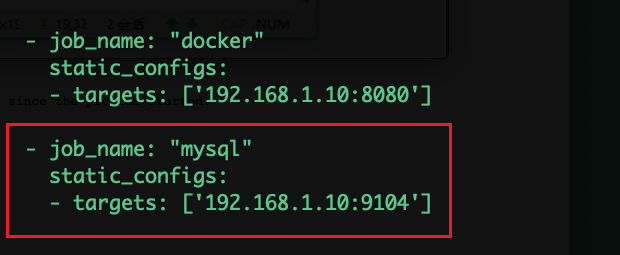
  - job_name: "mysql"
    static_configs:
    - targets: ['192.168.1.10:9104']
systemctl restart prometheus.service
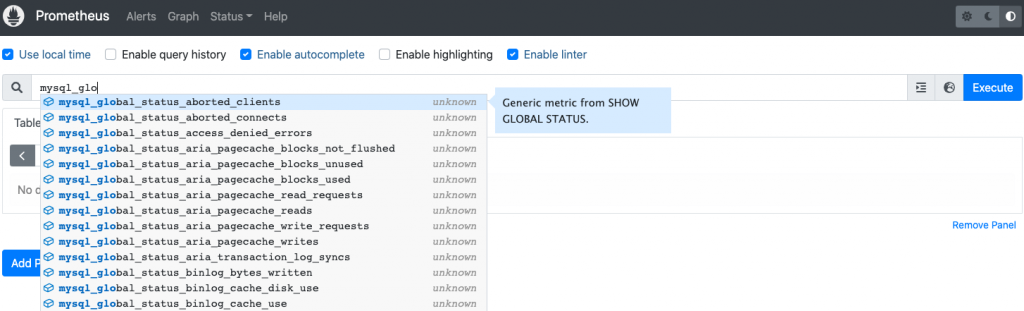
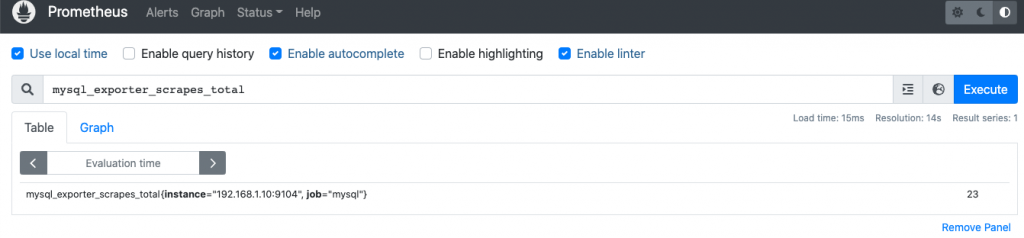
指标可以查询
模版连接地址:
7362
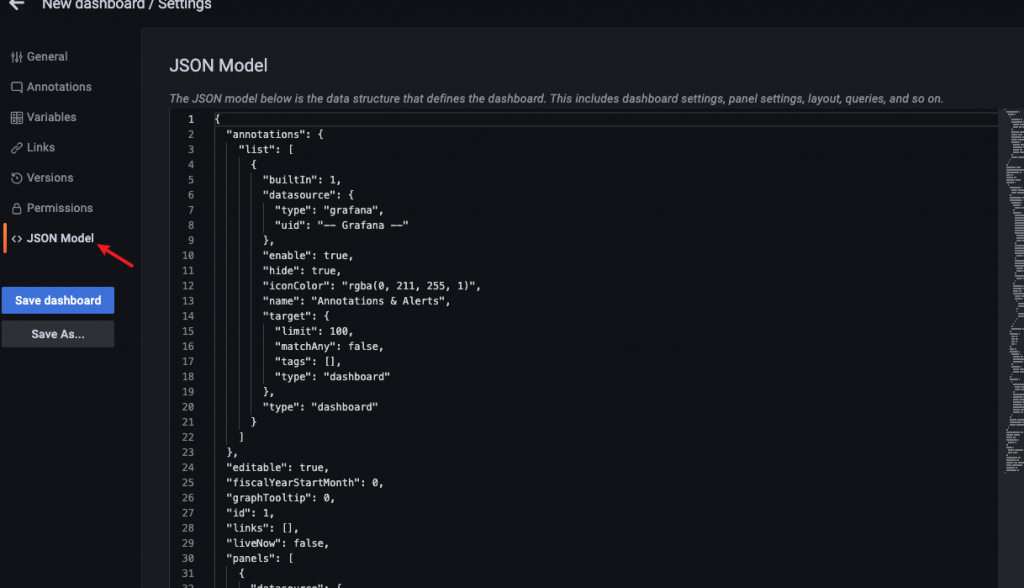
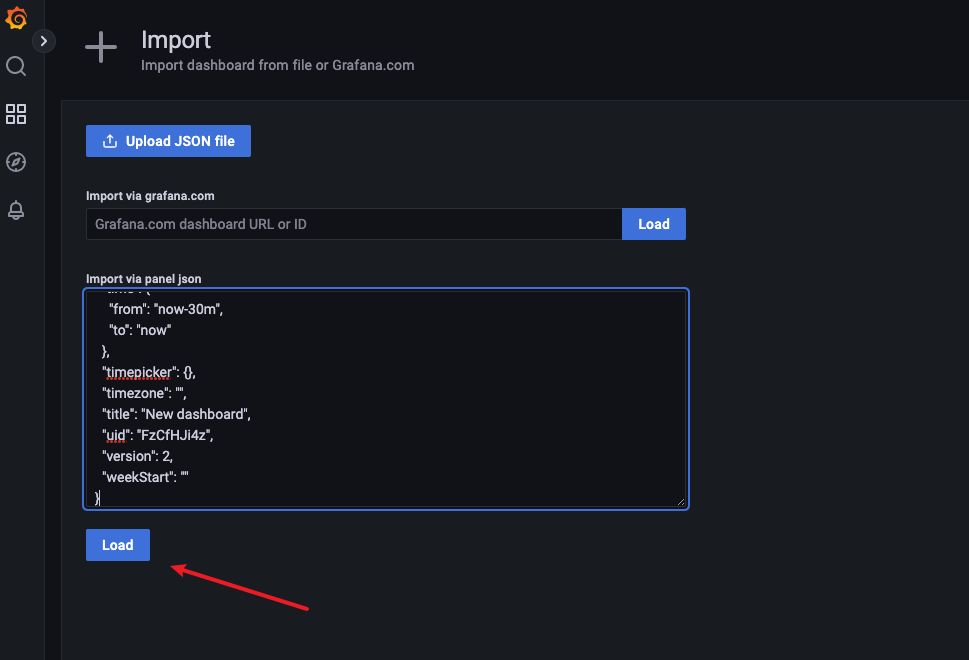
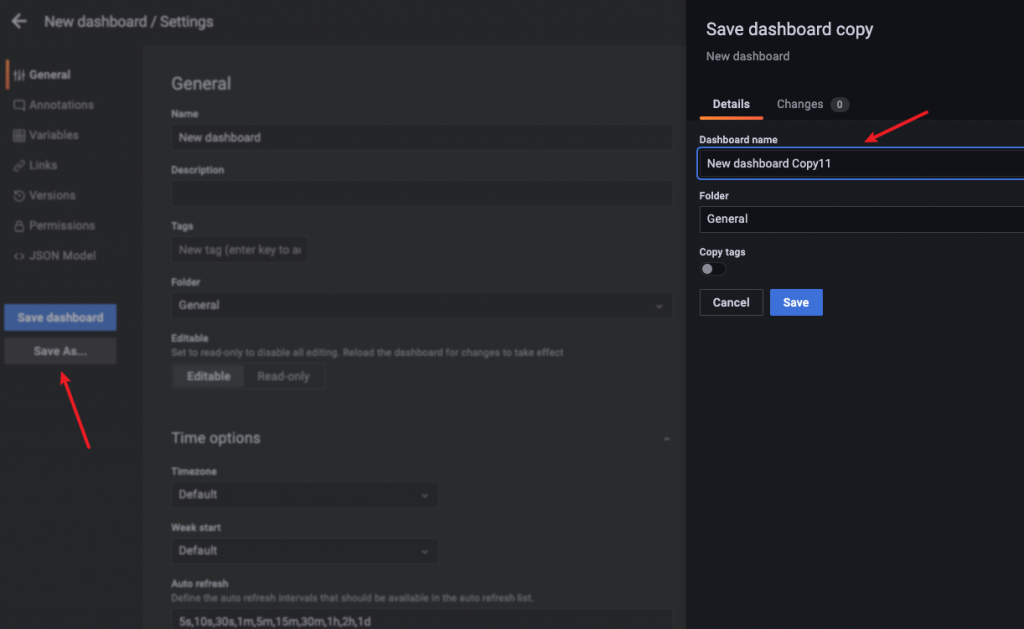
Grafana json备份 和 还原
将全部的json copy出来 保存到第⼀个地⽅,以备不时之需
Grafana⽀持将 json导⼊ 还原成 dashboard
也可以使用save as备份
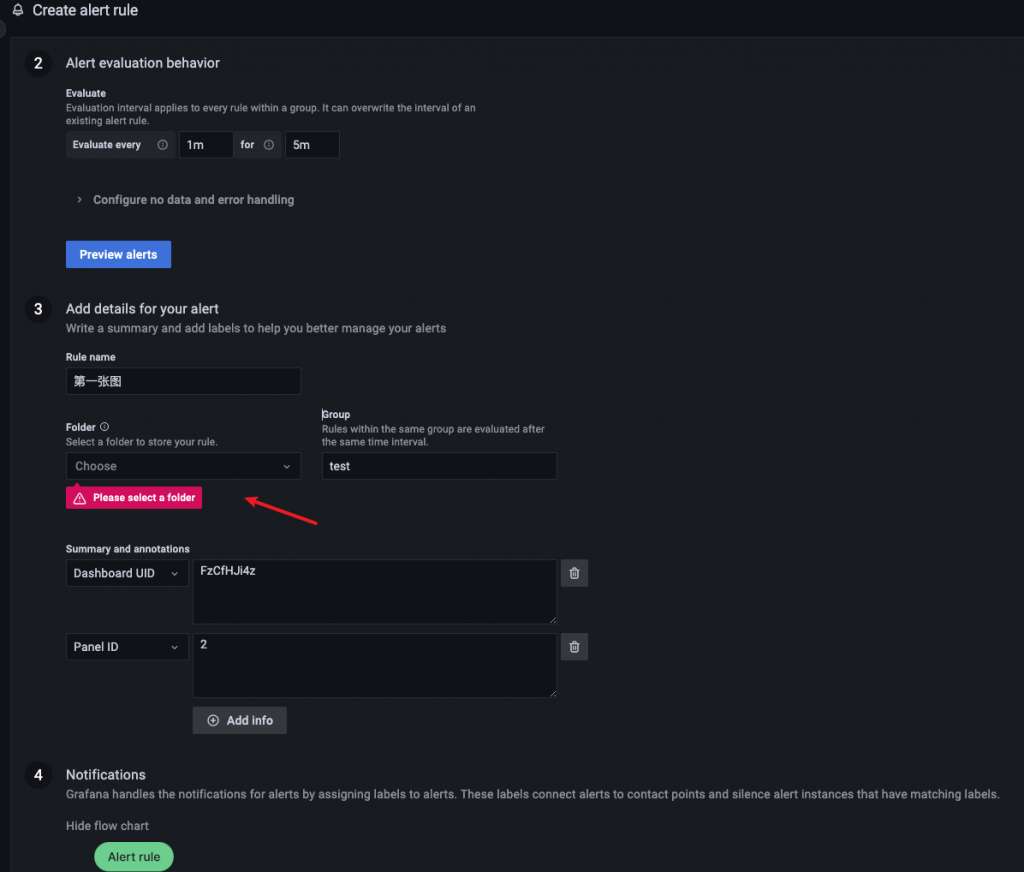
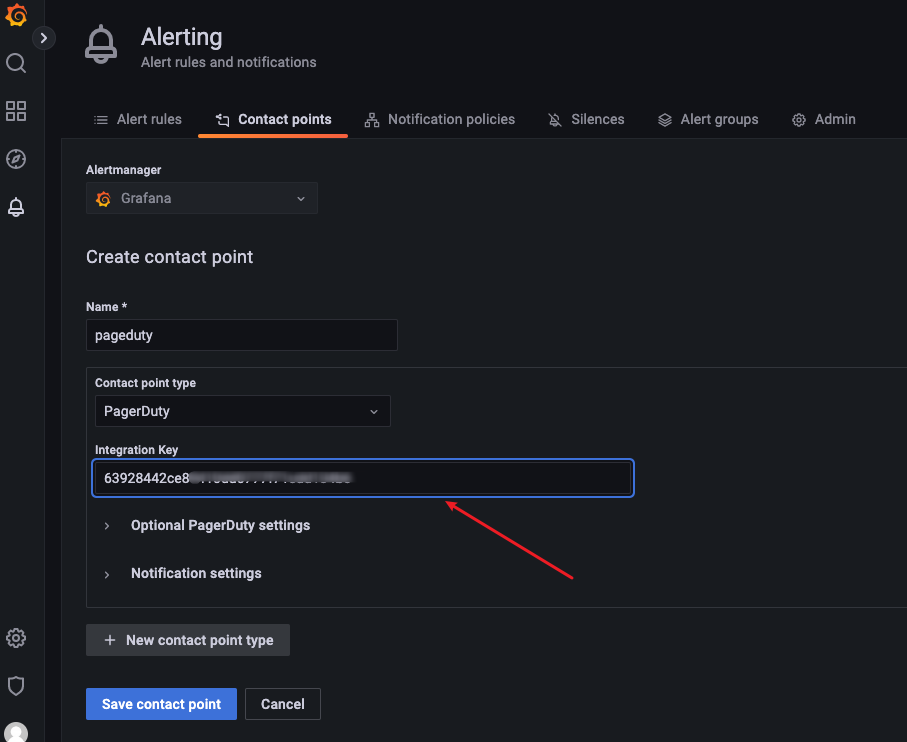
Grafana 实现报警功能 连接(4.0新功能 )
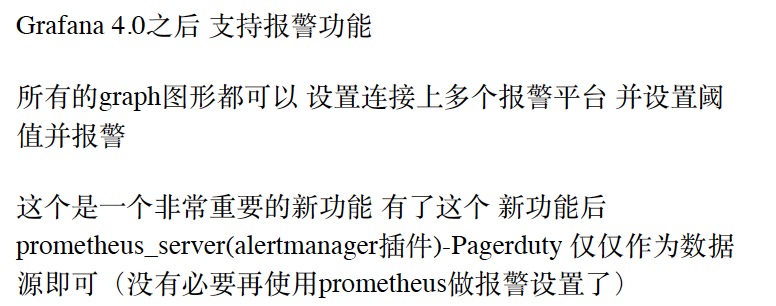
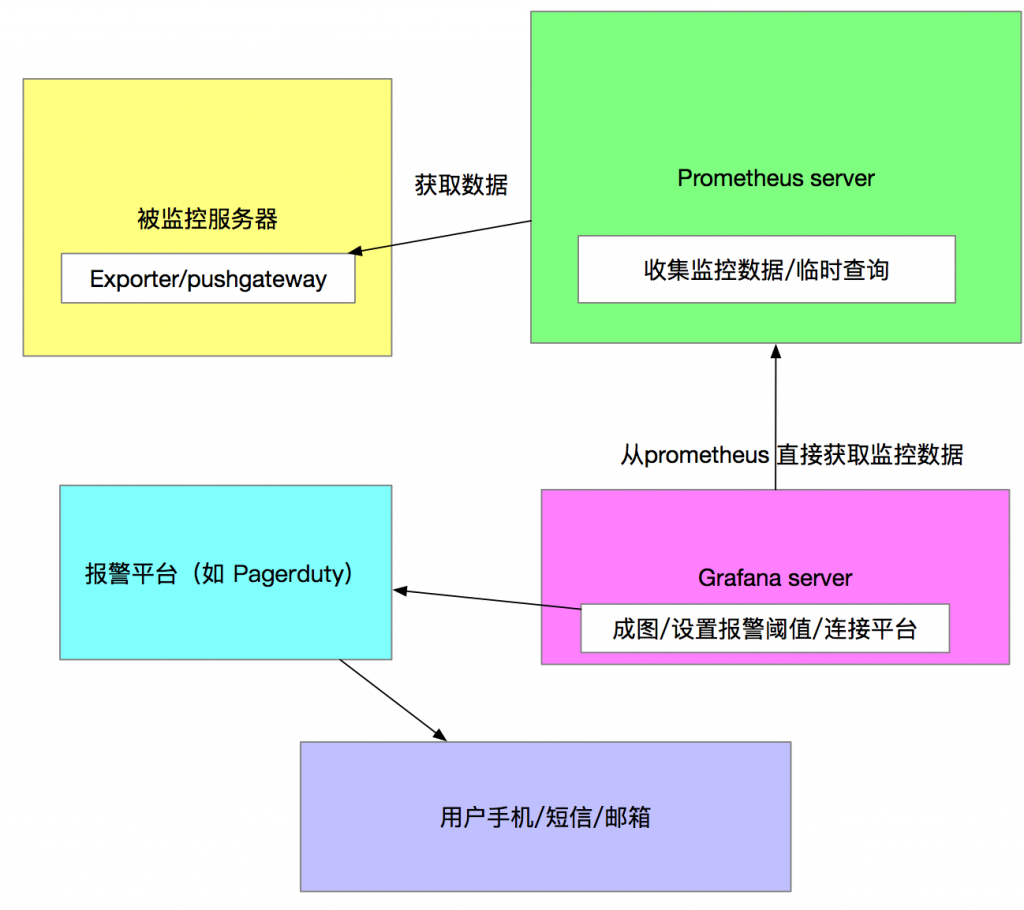
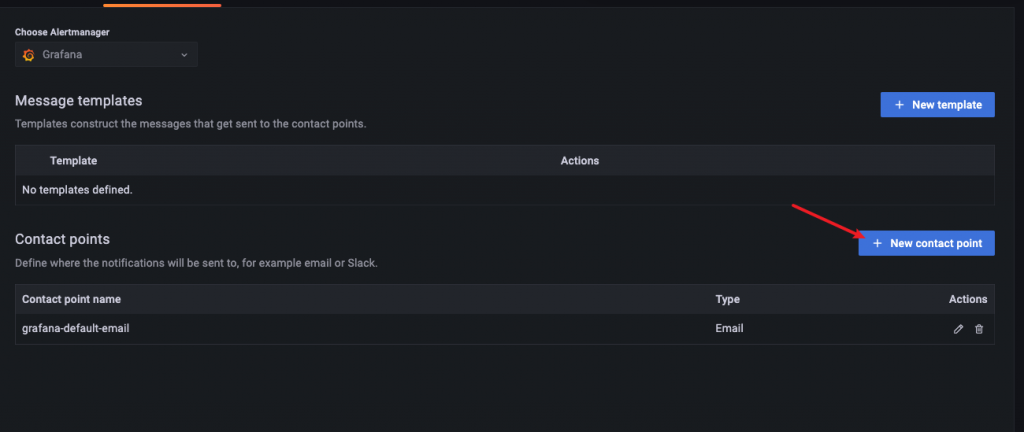
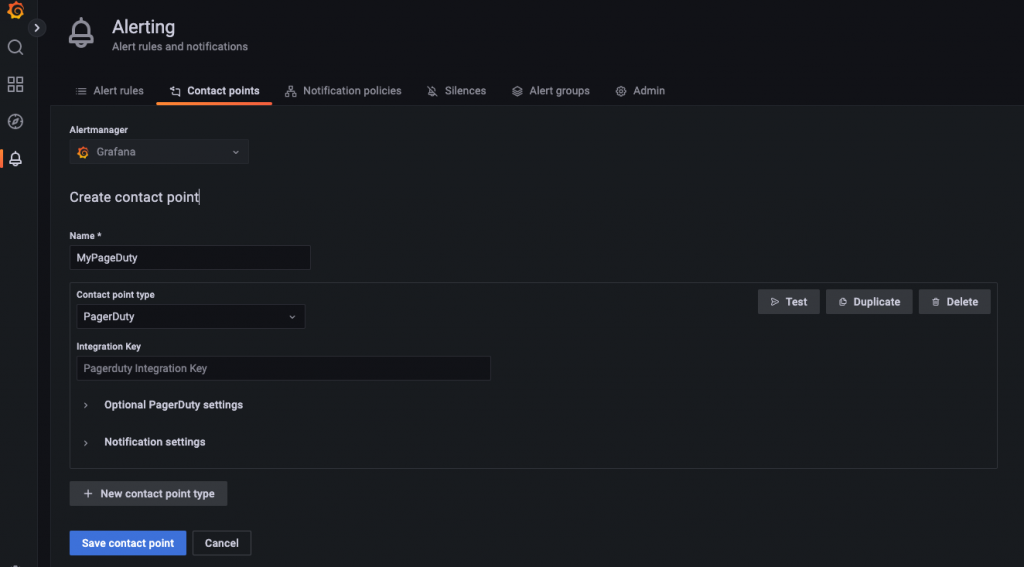
如此设置 让这个Channel 连接Pagerduty报警平台,并黏贴上 那⼀串从Pagerduty申请的 注册码
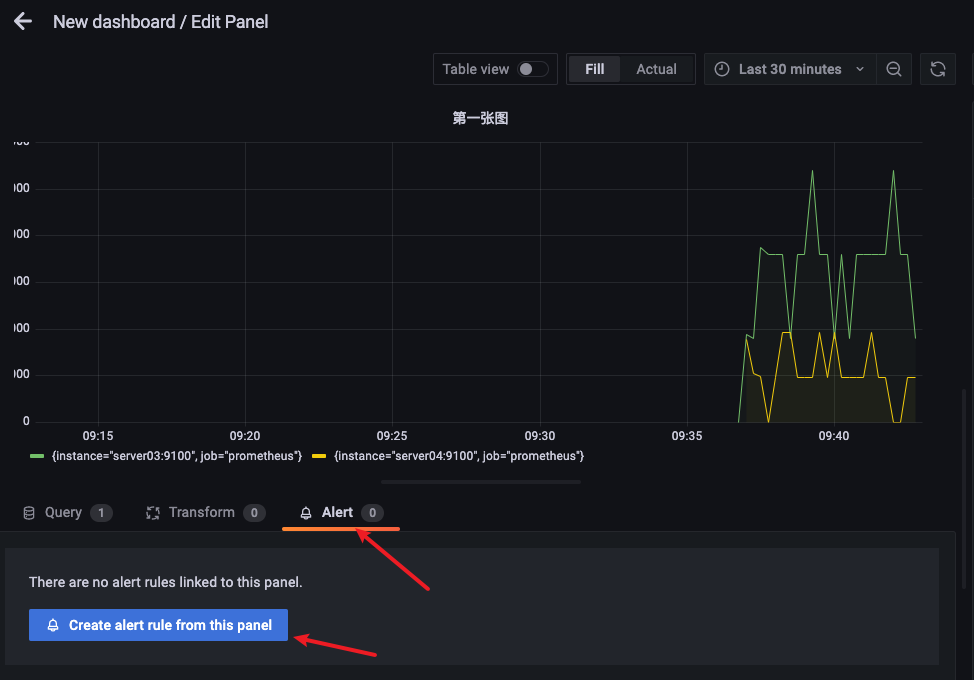
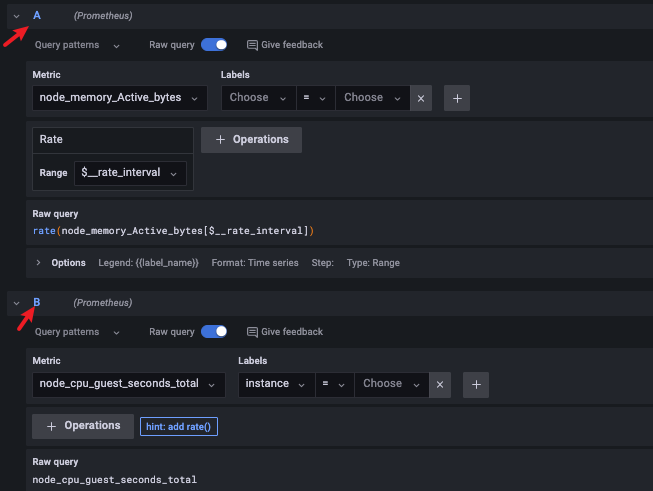
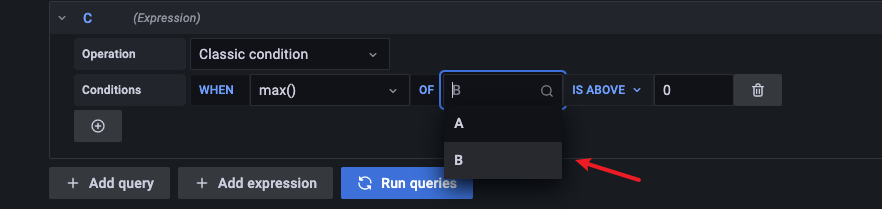
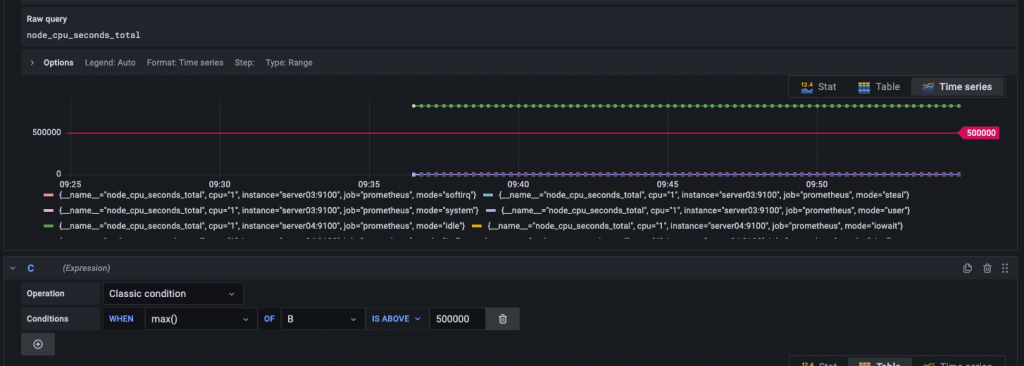
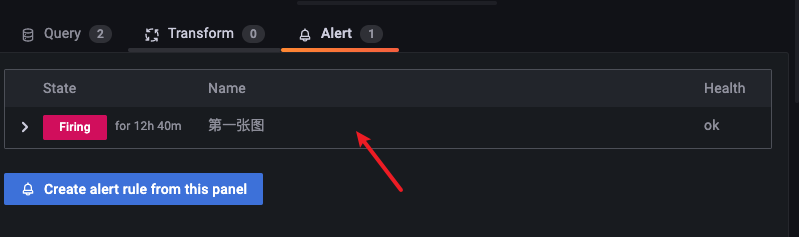
如果有多个查询语句,则在告警中可以选择
创建文件和组
Prometheus 企业级实际使⽤
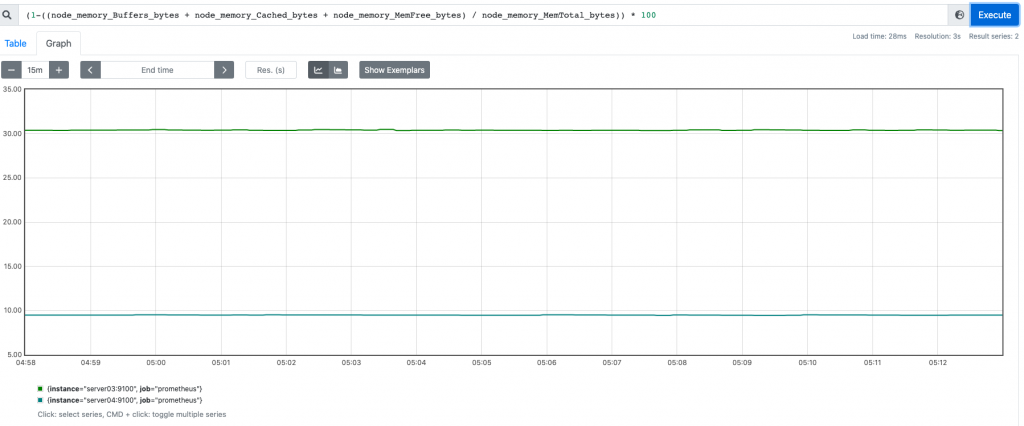
prometheus+grafana 企业内存监控 真实案例
我们先从Linux命令来看起
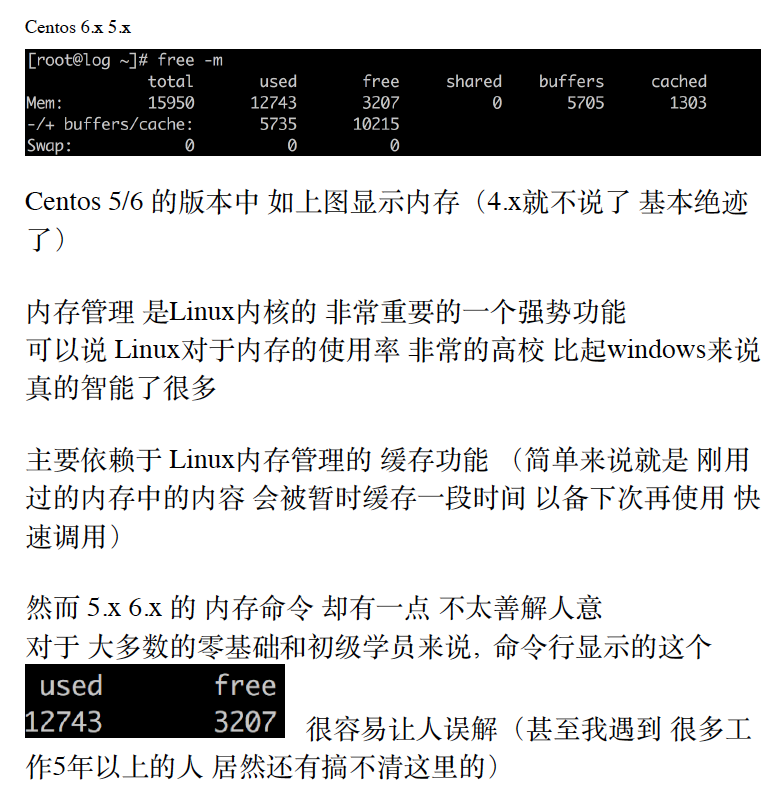

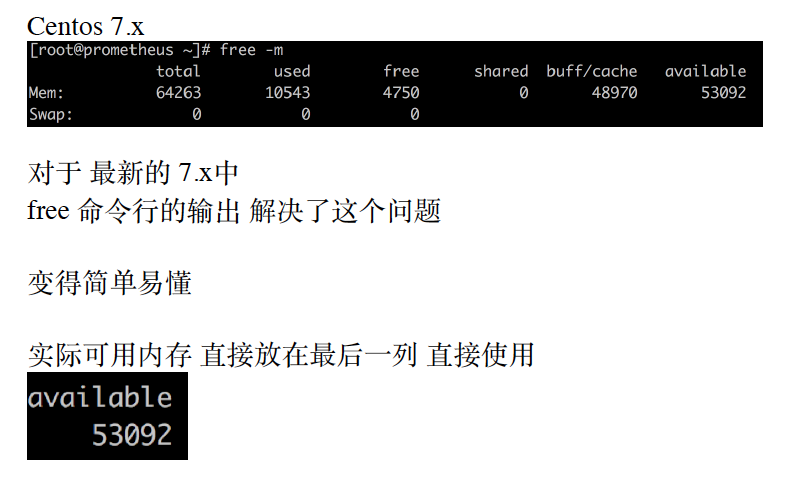
(1-((node_memory_Buffers_bytes + node_memory_Cached_bytes + node_memory_MemFree_bytes) / node_memory_MemTotal_bytes)) * 100

prometheus+grafana 企业硬盘/IO监控 真实案例
(node_filesystem_free_bytes / node_filesystem_size_bytes) < 0.2
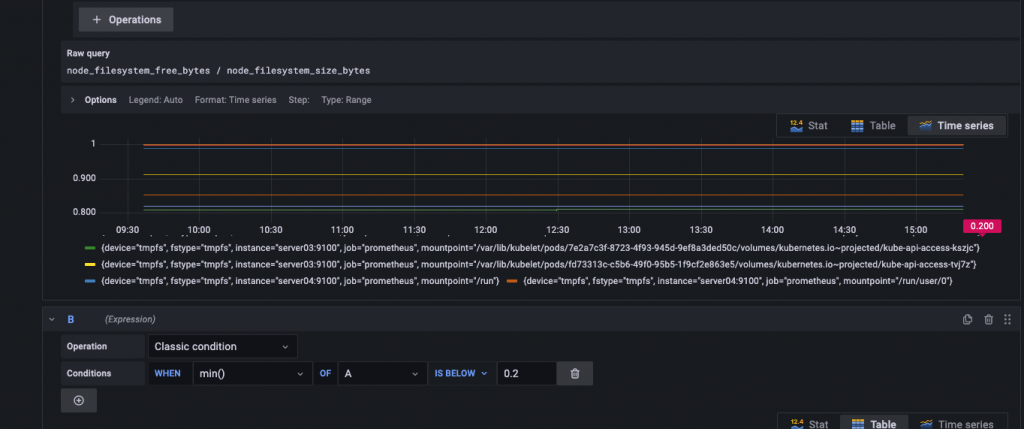
公式上看 也很好理解 当空闲硬盘 ⼩于 0.2的时候 就显⽰在图上


官⽹有 predict_linear()的 使⽤⽅法介绍
https://prometheus.io/docs/prometheus/latest/querying/functions/#predict_linear()
另外 也有针对这个 函数的 基础理论 Linear 数学计算模型 的介绍
https://en.wikipedia.org/wiki/Simple_linear_regression

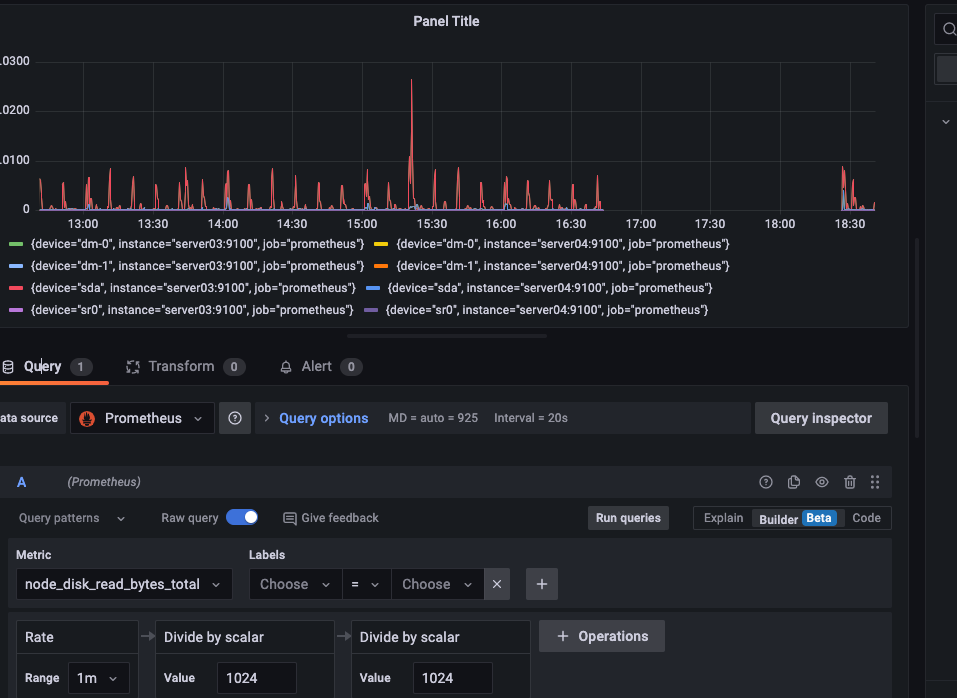
硬盘IO使⽤的监控
使⽤的公式
(rate(node_disk_read_bytes_total[1m] )+rate(node_disk_written_bytes_total[1m])) / 1024 /1024
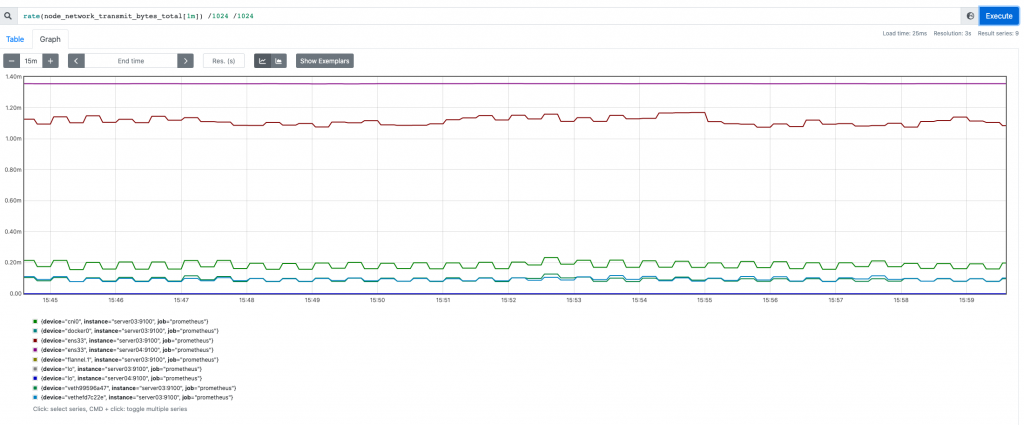
prometheus+grafana 企业⽹络传输 真实案例
rate(node_network_transmit_bytes_total[1m]) /1024 /1024
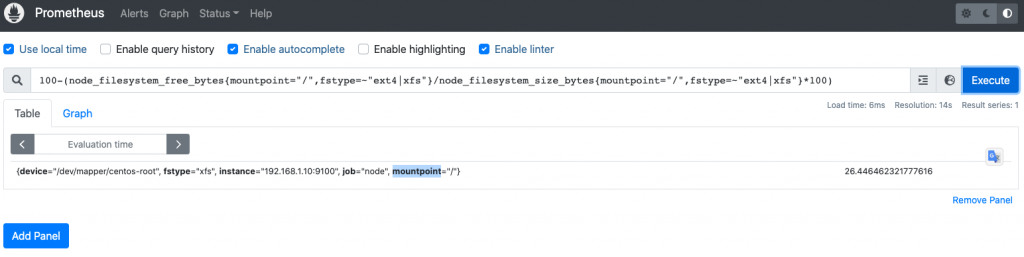
磁盘使用率监控
100-(node_filesystem_free_bytes{mountpoint=”/”,fstype=~”ext4|xfs”}/node_filesystem_size_bytes{mountpoint=”/”,fstype=~”ext4|xfs”}*100)
这条promesql命令通过 挂载点为根目并匹配ext4或者是xfs文件系统 剩余磁盘空间/磁盘总空间 来确定磁盘使用率
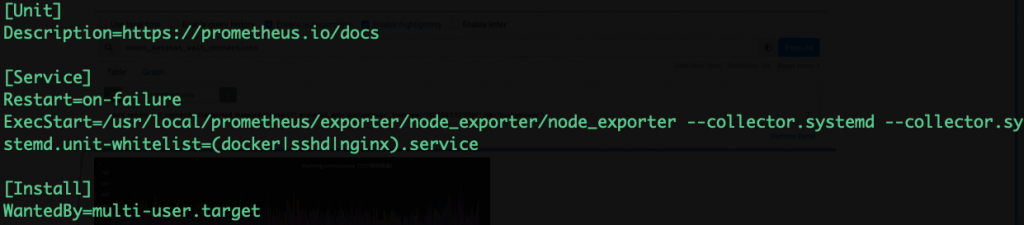
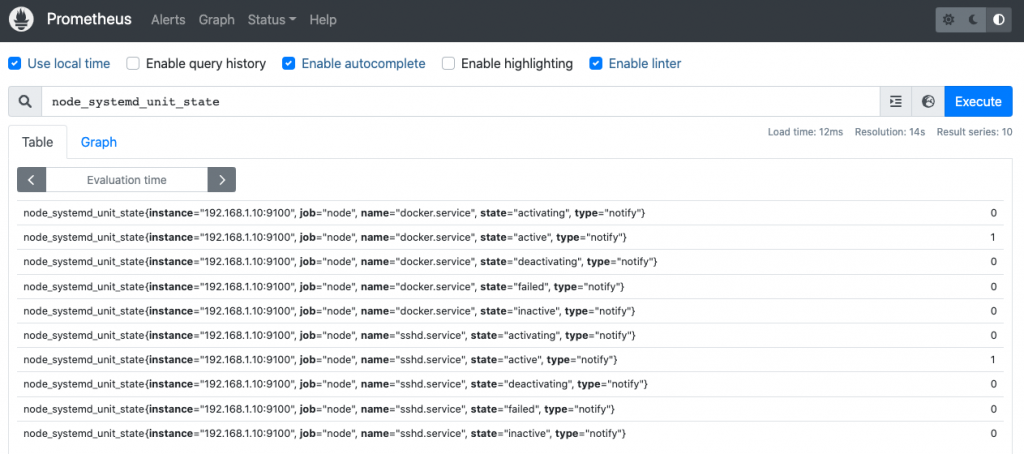
监控服务状态:
使用node_exporter监控服务状态
vi /usr/lib/systemd/system/exporter.service
node_exporter –collector.systemd –collector.systemd.unit-whitelist=(docker|sshd|nginx).service
交给systemed执行
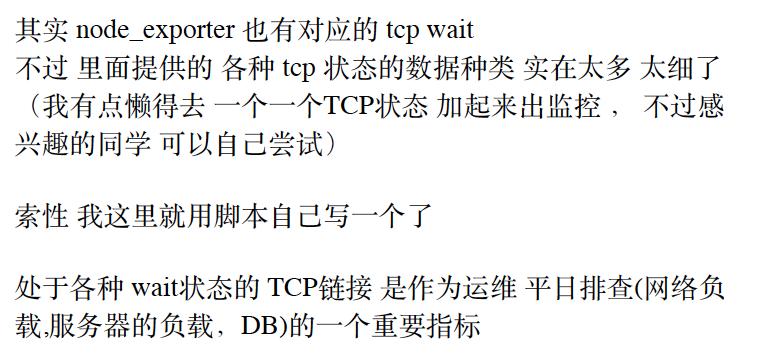
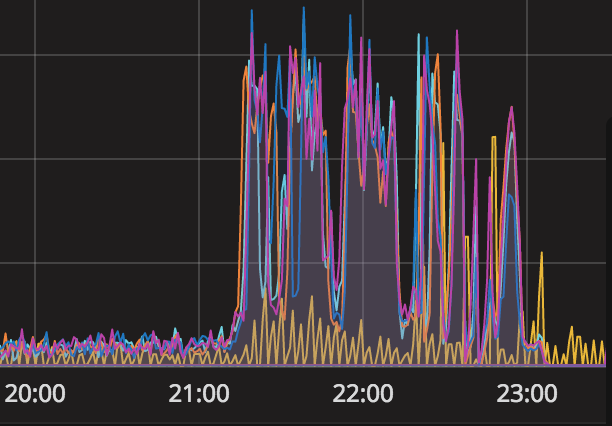
Prometheus+grafana TCP等待链接监控 企业实际使⽤
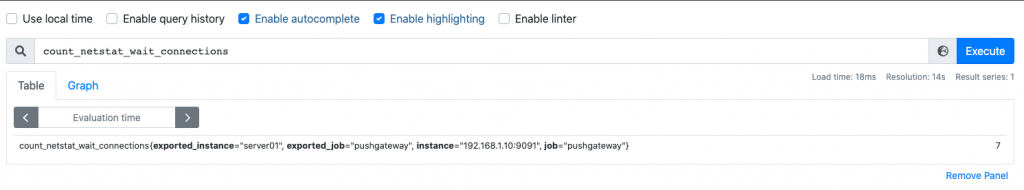
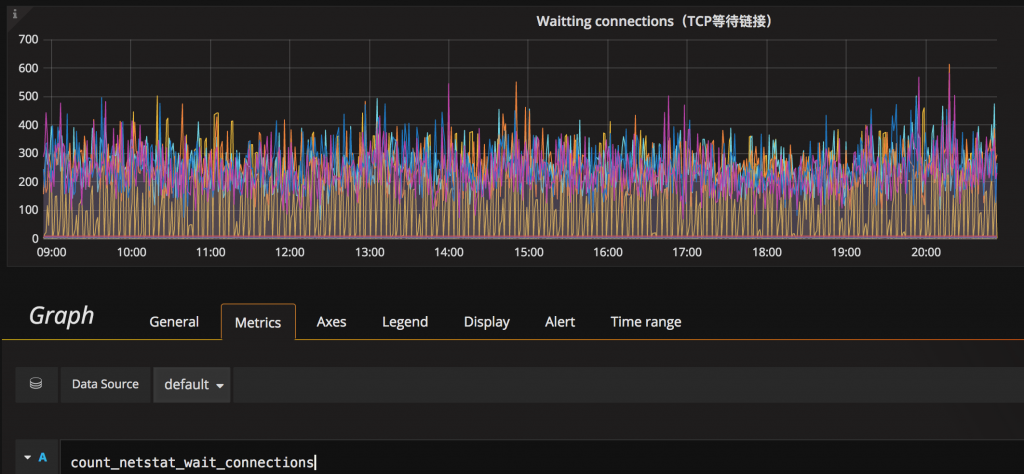
使⽤公式
count_netstat_wait_connections ⼀个key⾜够了 gauge
数据来源:pushgateway +脚本


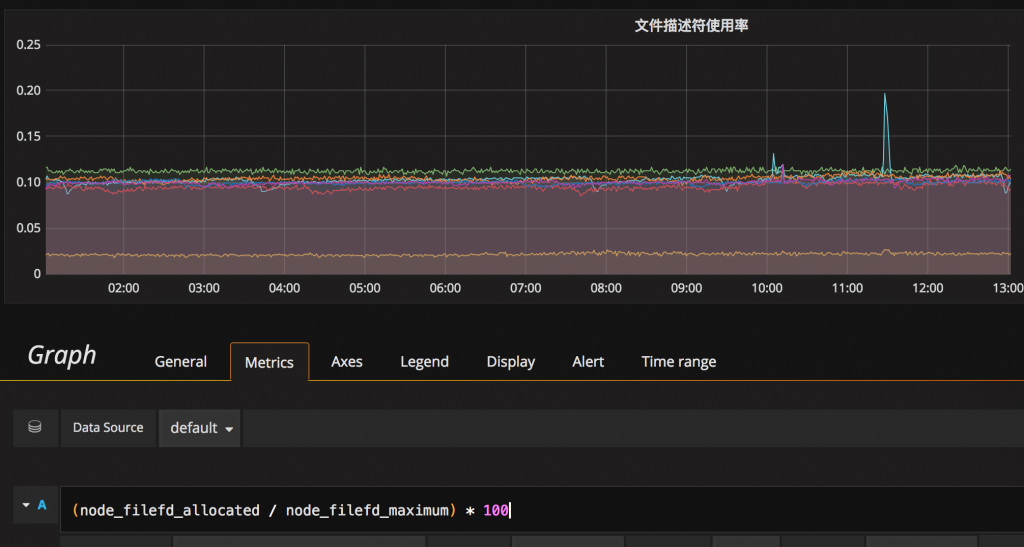
Prometheus+grafana ⽂件描述符监控 企业实际使⽤
如下是⼀段 ⽹上对⽂件描述符的解释 我们来看下

(node_filefd_allocated/node_filefd_maximum) * 100
Prometheus+grafana ⽹络丢包率和延迟监控 企业实际使⽤
开启一个9092端口的pushgateway

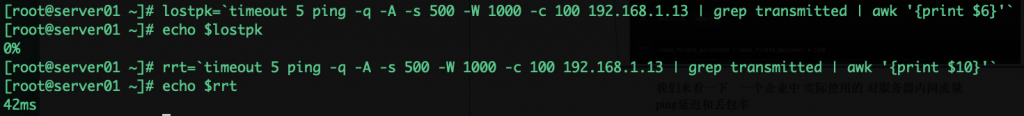
lostpk=`timeout 5 ping -q -A -s 500 -W 1000 -c 100 192.168.1.13 | grep transmitted | awk ‘{print $6}’`
rrt=`timeout 5 ping -q -A -s 500 -W 1000 -c 100 192.168.1.13 | grep transmitted | awk ‘{print $10}’`

去掉特殊符号:
value_lostpk=`echo $lostpk | sed "s/%//g"`
value_rrt=`echo $rrt | sed "s/ms//g" `
echo "lostpk_"$instance_name"_to_prometheus $value_lostpk" | curl --data-binary @- http://192.168.1.10:9092/metrics/job/pushgateway1/instance/server01:9092echo "rrt_"$instance_name"_to_prometheus $value_rrt" | curl --data-binary @- http://192.168.1.10:9092/metrics/job/pushgateway1/instance/server01:9092脚本:ping.sh
#!/bin/bash
instance_name=`hostname -f | cut -d'.' -f1` #本机机器名 变量⽤于之后的 标签
if [ $instance_name == "localhost" ];then # 要求机器名 不能是localhost 不然标签就没有区分了
echo "Must FQDN hostname"
exit 1
fi


# For waitting connections
# 获取丢包率和延迟时间(毫秒)
lostpk=`timeout 5 ping -q -A -s 500 -W 1000 -c 100 192.168.1.13 | grep transmitted | awk '{print $6}'`
rrt=`timeout 5 ping -q -A -s 500 -W 1000 -c 100 192.168.1.13 | grep transmitted | awk '{print $10}'`
#去掉特殊符号
value_lostpk=`echo $lostpk | sed "s/%//g"`
value_rrt=`echo $rrt | sed "s/ms//g" `

echo "lostpk_"$instance_name"_to_prometheus $value_lostpk"
echo "lostpk_"$instance_name"_to_prometheus $value_lostpk" | curl --data-binary @- http://192.168.1.10:9092/metrics/job/pushgateway1/instance/localhost:9092
echo "rrt_"$instance_name"_to_prometheus $value_rrt"
echo "rrt_"$instance_name"_to_prometheus $value_rrt" | curl --data-binary @- http://192.168.1.10:9092/metrics/job/pushgateway1/instance/localhost:9092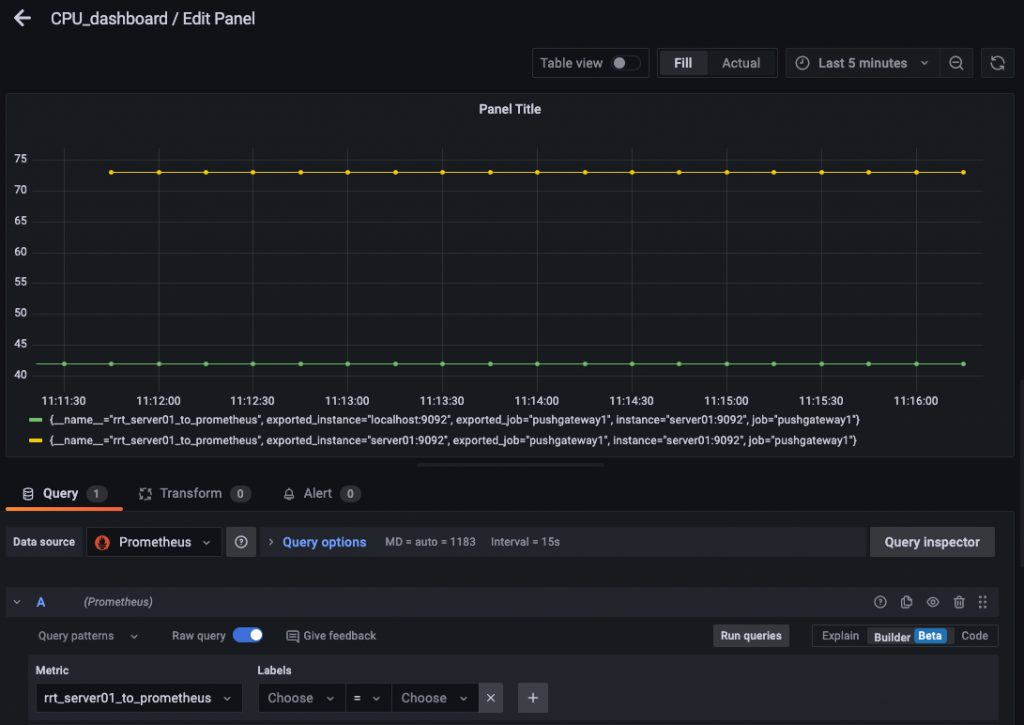
Pagerduty的联⽤
pagerduty 注册新账号
https://signup.pagerduty.com/accounts/new
pagerduty 创建新的service
在集成的时候选择prometheus

获取密钥
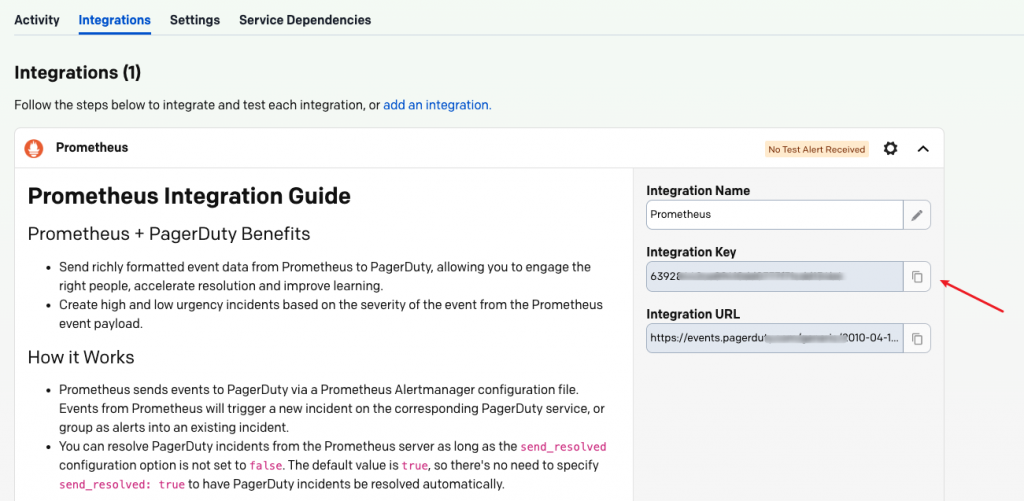
之后我们把 ⽣成的这个 new service ’s interation key 复制到我们grafana平台的 notification_channel中
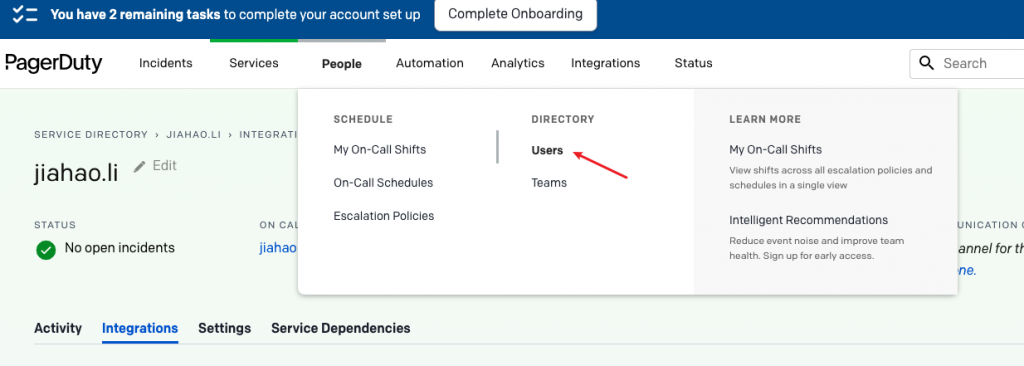
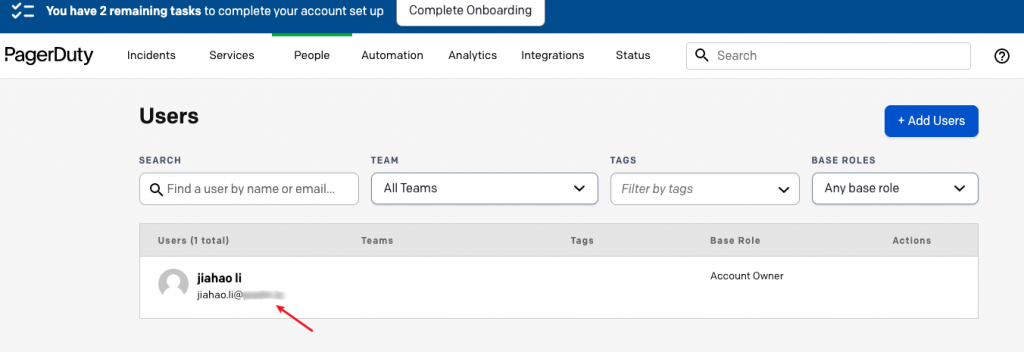
pagerduty 报警信息的设置

找到 设置⾥的 users选项卡
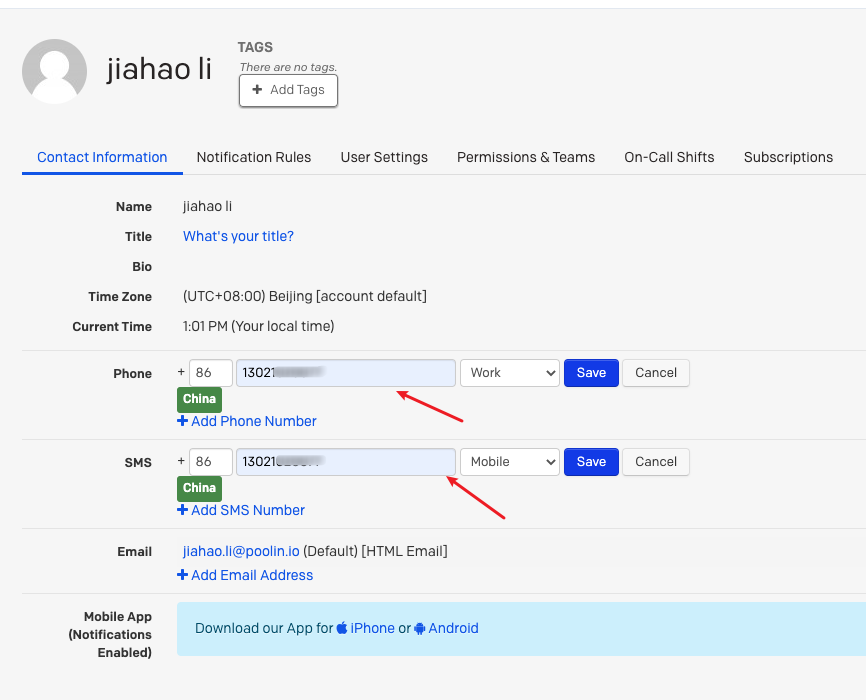
在这⾥ 我们给账号 设置⼀个 ⽤于接收报警的 三项设置信息
电话 / 短信 / 邮箱

发布者:LJH,转发请注明出处:https://www.ljh.cool/7379.html